
Budget Enterprise Tool
Written by Kevin Jarek, Regional Crops and Soils Educator, UW-Madison Division of Extension and Jerry Clark, Regional Crops and Soils Educator, UW-Madison Division of Extension
Overview
Your cost of production is going to be critical to identify when markets offer an opportunity to sell in 2026. A crop budget does not have to be perfect. The budget should include income and costs directly related to producing the crop. The Crops Enterprise Budget Tool created by the University of Wisconsin-Madison Division of Extension provides an estimate of total costs and allows for determination of a potential profit or loss using a sensitivity table. Cost of production sheets exist for common grain and forage crops grown in Wisconsin.
The values represented in the UW Crop Enterprise Budget Tool are the results of direct interviews with Wisconsin farmers, independent crop consultants, seed dealers, local cooperatives, and other agricultural professionals. The example budgets represent average values. The prices associated with inputs and expenses, as well as the value of the commodities, are subject to change between now and the 2026 planting season. Your actual costs and expenses may vary. This spreadsheet allows you to enter your own individual inputs and expenses associated with growing and harvesting multiple different crops. Example budgets provide estimated values to serve as a starting point.
Getting Started
The first information needed for any budget calculation is income. Begin with determining yields and sale prices for the upcoming crops. Use a high and low price to determine a range of potential income if the commodity has not yet been priced. The key to the income section within a crop budget is to identify realistic yield goals. Consider market prices or contracts currently being offered when yield goals are determined.
Once potential income is calculated, it is time to evaluate expenses. Expenses are typically categorized as variable costs and fixed costs. Variable costs are those needed to grow the crop each year, such as seed, fertilizer, and crop protection products. Fixed costs are those that will be incurred regardless of whether the crop is grown or not. Fixed costs include expenses such as interest, repairs, taxes and depreciation.
Determining Expenses
A good place to start with a crop enterprise budget is with soil fertility inputs. Soil testing to determine your crop nutrient needs is the best way to optimize these expenses and reduce spending on unnecessary crop nutrients. Guidance and recommendations from university resources can help fine-tune soil nutrient application rates and fertility needs.
Fertilizer rates were determined using A2809 Nutrient Application Guidelines for Field, Vegetable, and Fruit Crops in Wisconsin at https://cropsandsoils.extension.wisc.edu/university-of-wisconsin-madison-a2809-nutrient-application-guidelines-for-field-vegetable-and-fruit-crop-update/.
Updated UW guidelines are being developed and when completed will be posted at https://cropsandsoils.extension.wisc.edu/nutrient-application-guidelines-for-field-vegetable-and-fruit-crops-in-wisconsin-a2809/#Grains.
Table 1. Difference in N, P205 and K20 Values – 10,000 Gallons of Liquid Dairy Manure Incorporated 1 Hour to 3 Days
Source: https://cropsandsoils.extension.wisc.edu/articles/nutrient-management-fast-facts-magazine/
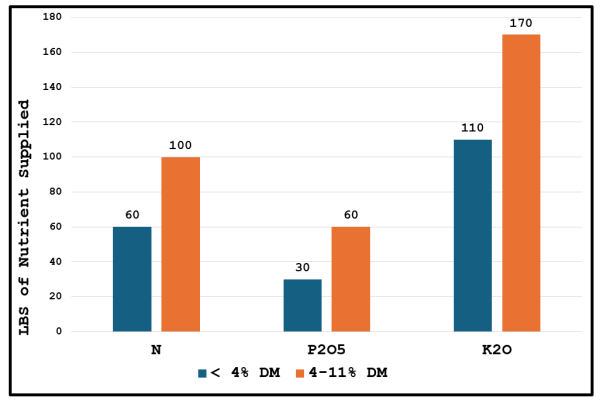
Table 1 Image Description
| LBS of Nutrient | <4% DM | 4-11% DM |
| N | 60 | 100 |
| P205 | 30 | 60 |
| K20 | 110 | 170 |
Manure is widely available in Wisconsin and can be credited towards your crop’s total nutrient needs. However, the economics associated with handling and applying manure can vary significantly. Table 1 illustrates the estimated total quantity of nutrients for crop use in the first year after spreading for liquid dairy manure that is incorporated between one hour to three days after application. Manure that is 4-11% dry matter (DM) may contain significantly more nutrients than manure that is less than 4% DM.
The most accurate method to determine the total nutrient content of your manure is to have a lab analysis performed. Nutrient management guidelines should be followed when selecting fields for application.
Table 2. Difference in N, P205 and K20 $ Values – 10,000 Gallons of Liquid Dairy Manure Incorporated 1 Hour to 3 Days
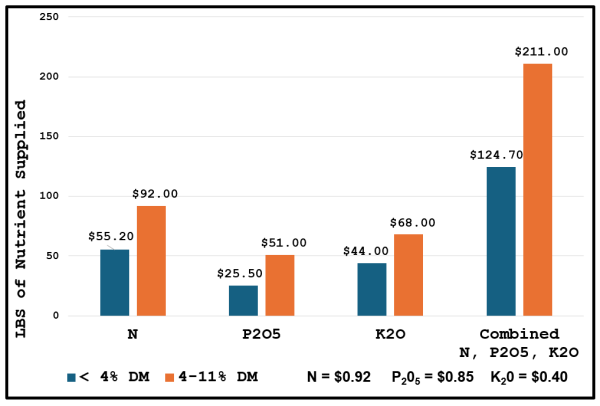
Table 2 Image Description
| LBS of Nutrient | <4% DM | 4-11% DM |
| N | $55.20 | $92.00 |
| P205 | $25.50 | $51.00 |
| K20 | $44.00 | $68.00 |
| Combined N, P205, K20 | $124.70 | $211.00 |
Table 2 illustrates the total economic value of nitrogen (N), phosphorus (P2O5), and potassium (K2O) from a 10,000 gallon/acre application of liquid dairy manure incorporated within one hour to three days. The value of N ($0.92/lb.), P2O5 ($0.85/lb.), and K2O ($0.40/lb.) are subject to change.
Table 3. Net Gain or Loss of Nutrient Value vs Cost of Custom Applying 10,000 Gallons of Liquid Dairy Manure Incorporated 1 Hour to 3 Days
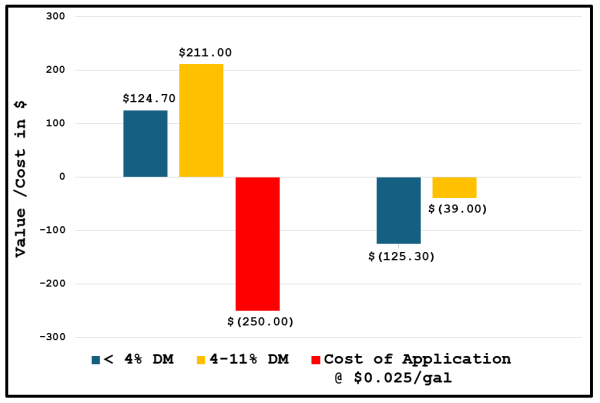
Table 3 Image Description
| <4% DM | 4-11% DM | Cost of Application at $0.025/gal |
| $124.70 | $211.00 | -$250.00 |
| -$125.30 | -$39.00 |
Table 3 illustrates the total value of the manure nutrients less the cost of hauling and application at $0.025 cents per gallon. This value may reflect the cost of transporting manure several miles away from the farm. As the distance manure is transported increases, the cost will also increase.
Table 4. Net Gain or Loss of Nutrient Value vs Cost of Custom Applying 5,000 Gallons of Liquid Diary Manure Incorporated 1 Hour to 3 Days
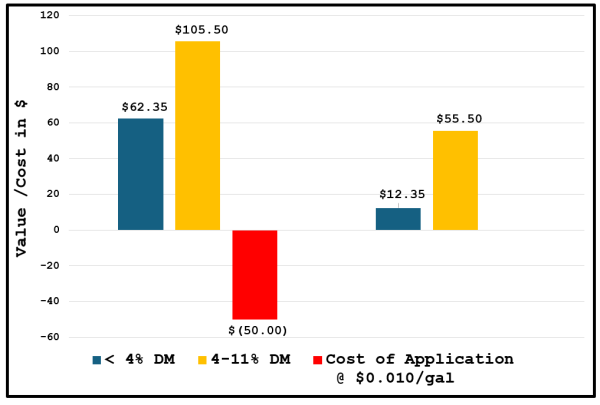
Table 4 Image Description
| <4% DM | 4-11% DM | Cost of Application at $0.010/gal |
| $62.35 | $105.50 | $-50.00 |
| $12.35 | $55.50 |
When shorter distances are involved, the cost of handling and application may be lower per gallon. Farms that may need additional acreage to spread manure to comply with nutrient management plans may cover these costs. Table 4 illustrates how the cost of application impacts the profitability of manure handling.
Seed costs along with soil fertility inputs can equate to half of the variable costs. Consider lowering corn and soybean seeding rates in fields planted on time with well-maintained equipment that is operating properly. Specific UW-Madison recommendations for planting population will be discussed in each of the individual crop sections. Hybrid and variety selection can play a huge role in the size of the margin. In University of Wisconsin corn hybrid performance trials, the difference in yield from the top-performing corn hybrid to the bottom is 70 bushels (bu.) per acre. This equates to over 8 tons per acre of as-fed corn silage. Table 5 illustrates soybeans average 17 bu./acre difference from the top yielding to the lowest yielding variety over the past three years. Using $9.00/bu. we can calculate a $153.00/acre difference between the top and the bottom varieties, at $13.00/bu. the difference increases to $221.00/acre. The genetic and yield potential of the soybean seed you purchase can have a profound impact on profitability in any given growing season.
Table 5. Difference Between Highest Yielding and Lowest Yielding Soybeans. Source: Shawn Conley, Soybean and Small Grains Specialist, UW-Madison
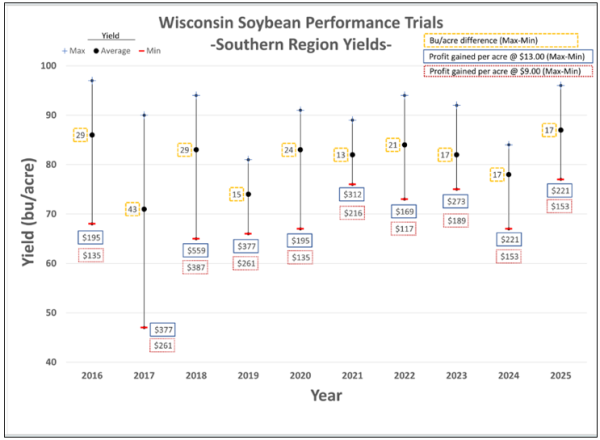
Table 5 Image Description
| Year | Maximum Yield | Minimum Yield | Yield Bu/acre Difference (Max-Min) | Profit Gained per Acre at $13.00 (Max-Min) | Profit Gained per Acre at $9.00 (Max-Min) |
| 2016 | 97 | 68 | 29 | $195 | $135 |
| 2017 | 90 | 47 | 43 | $377 | $261 |
| 2018 | 94 | 65 | 29 | $559 | $387 |
| 2019 | 81 | 66 | 15 | $377 | $261 |
| 2020 | 91 | 67 | 24 | $195 | $135 |
| 2021 | 89 | 76 | 13 | $312 | $216 |
| 2022 | 94 | 73 | 21 | $169 | $117 |
| 2023 | 92 | 75 | 17 | $273 | $189 |
| 2024 | 84 | 67 | 17 | $221 | $153 |
| 2025 | 95 | 78 | 17 | $221 | $153 |
UW-Madison Wisconsin corn hybrid and performance results are available at: https://badgercropnetwork.com/wisconsin-corn-hybrid-performance-trials-2025/.
UW-Madison Wisconsin soybean variety and performance results are available at: https://badgercropnetwork.com/2025-wisconsin-soybean-performance-trials/.
UW-Madison Wisconsin winter wheat variety and performance results are available at: https://badgercropnetwork.com/research/small-grains/wheat-variety-trial-results/.
Pest management programs vary depending on management style, cropping system, and factors such as chemical-resistant pests and prevailing weather conditions. Changing and emerging insect, weed, and disease pressure require varying levels of pest management inputs. Crop scouting is the best method to determine field pest infestation levels and control options. Implementing an integrated pest management (IPM) program often helps optimize pest control costs. The Pest Management for Wisconsin Field Crops Guide is available at https://cropsandsoils.extension.wisc.edu/files/2025/01/A3646_2025_web.pdf.
Land is often one of the higher costs when estimating cost of production, as it can amount to 20% to 40% of the total cost of production. The minimum cost to owned cropland is the tax rate if the land is paid off. If you are still making payments, the principal and loan interest payments themselves can be calculated on a cost per acre basis.
Use the current cropland rate if you rent the land. Land rental rates vary tremendously across the state of Wisconsin. The 2025 National Agricultural Statistics Service (NASS) determined the statewide average cropland rental rate in Wisconsin was $161.00/acre for non-irrigated cropland. We have used $190.00/acre in this example. A full map and interactive tool illustrating not only Wisconsin, but neighboring states cropland rental rates is available at https://farms.extension.wisc.edu/topics/pricing-and-contracts/land-lease-and-rental/farmland-rental-values/county-cash-rent/.
Another option to calculate cropland expense is to use an opportunity cost value. We can calculate a return on investment to determine its value. First, identify the desired rate of return, for this example we will use four percent. If land has a market value of $6,000.00/ acre and we want a rate of return of 4% then the rental rate would be $240.00/acre.
Tillage and planting operations can be considered a variable cost related to the fuel and labor, and a fixed cost when machinery depreciation is calculated. One way to estimate these costs is to use a custom rate available from many university Extension services. The custom rate often includes machinery, fuel and labor costs. Keep in mind that custom rates may or may not reflect your actual costs, making them a place to start.
Values referenced in these budgets are based on costs identified in the Custom Rates for 2024 Wisconsin Farm Operations at https://farms.extension.wisc.edu/articles/custom-rates-for-2024-wisconsin-farm-operations/ and the 2026 Iowa Farm Custom Rate Survey at https://www.extension.iastate.edu/agdm/crops/html/a3-10.html. Harvest and storage costs need to be included in the crop production budget. Harvest machinery should include all equipment needed to get the crop into storage, such as crop harvesting equipment, wagons, trucks, tractors and semis, to name a few.
Crop storage costs can be simple or complex to calculate. Fixed costs include the storage facility and accompanying depreciation and interest to store the crop if you own your own structures. Hay and forage storage costs vary depending on the storage structure.
Labor and management are costs that often go unnoticed, especially unpaid labor and management. A rule of thumb to determine a value for management is to use 5% of gross revenue as a management charge. The University of Illinois has established the following estimates for the number of hours needed per acre depending on the farm size. Each farm needs to consider its own individual circumstances and labor needs. Planting and harvest times usually require additional help, so each crop has a 1.5-hour labor charge ($25.00/hr. X 1.5 hours = $37.50) added to each acre. Your operational capacity may differ.
Table 6. Estimated Number of Hours of Labor per Acre Based on Farm Size
Table 6 source: https://farmdocdaily.illinois.edu/2026/01/labor-standards.html
| Farm Size – Crops Acres | Estimated Number of Hours per Acre per Year |
| Less than 500 | 6.0 |
| 500 – 1,000 | 3.3 |
| 1,000 – 2,000 | 2.3 |
| More than 2,000 | 1.7 |
Crop insurance and other risk management tool expenses should be included in a crop budget estimate. Rates can vary widely depending on your location and your actual production history (APH) as well as the level of coverage desired. Each farm will need to determine their individual tolerance for risk and identify a policy combination that provides adequate risk mitigation while providing premiums that are affordable.
The following narratives correspond to the details contained in each of the individual crop enterprise budgets that have been created in the 2026 UW Crop Enterprise Budget Tool. Adjust the values to reflect the income and expenses incurred on your own farm. Individual budget tabs exist in the excel spreadsheet for many crops grown in Wisconsin.
2026 Corn Grain
The projected corn grain budget example in the UW Crop Enterprise Budget uses the following estimates. One hundred seventy-eight (178) bushels per acre yield represents the three-year average (2023-2025) WI corn grain yield posted by the National Agricultural Statistics Service (NASS). The $4.37/bushel value uses the average of the December 2026 futures contract ($4.72) and the May 2027 futures contract ($4.92) price less a basis of $0.45/bushel. Contract prices and basis will vary depending on your location and are subject to change.
Starter fertilizer used in this example was 10-34-0. Nitrogen (N) rate is determined using the approximate cost of $0.92/lb. of N derived from the fertilizer cost calculator tab in the spreadsheet. You should enter the cost of your purchase price for fertilizer inputs and calculate the value per pound of applied nutrient. The N rate was determined using the UW-Madison Division of Extension Maximum Return to Nitrogen Rate (MRTN) corn calculator available at https://cropsandsoils.extension.wisc.edu/articles/nutrient-management-fast-facts-magazine/.
A nitrogen:corn price ratio of 0.15 ($0.67 lb./N, $4.37 bu. corn) suggests 140-160 lbs. N/acre or a 0.20 ratio ($0.92 lb./N, $4.37 bu. corn) suggests 125-150 lbs. N/acre will be used in 2026. We will use 150 lbs. N per acre for our corn grain example since that value overlaps both the 0.15 and 0.20 nitrogen:corn price ratio ranges. Using phosphorus (P) and potassium (K) soil test levels in the optimum category, the P2O5 (70 lbs.) and K2O (50 lbs.) application rates per acre were calculated based on 171–191 bushel corn yields.
Manure and/or legume credits are not accounted for in this example, so those should be considered if available and are used as discussed earlier. Also, lime was not applied in this example, however, it can be added into the spreadsheet if necessary. Nitrogen credits will reduce fertilizer expenses. This example is a conventional tillage system; therefore, it does not include a cover crop. Information on cover crop options for no-till corn grain in Wisconsin are available at: https://cropsandsoils.extension.wisc.edu/articles/cover-crop-options-for-corn-grain-in-wisconsin/.
Table 7. Relationship Between Corn Plant Density and Grain Yield, Economic Optimum (AGI), Forage Yield, Milk/Ton, and Milk/Acre. Source: Lauer (Arlington 2008-2017)
Source: https://corn.aae.wisc.edu/AA/pdfs/A135.pdf
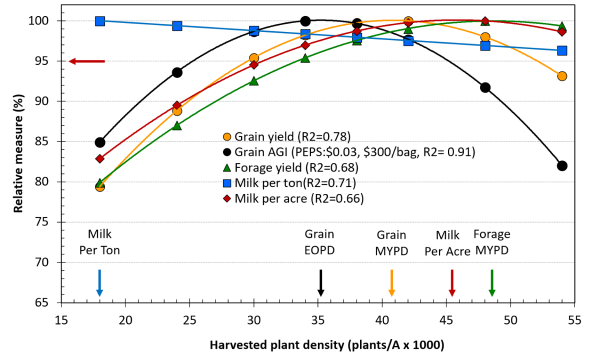
The corn seed expense was calculated using a planting rate of 36,000 seeds/acre at $300.00/bag (80,000 kernels/bag). Table 7 illustrates the research conducted by Dr. Joe Lauer, Corn Agronomist, UW-Madison. Dr. Lauer determined that the grain economic optimum plant density (EOPD) was 35,000 plants/acre while a population of 26,000 plants/acre yielded an EOPD within 95% of the maximum. Dr. Lauer notes that due to differences between farms, and fields within farms, the EOPD may vary from one site to another.
Dr. Lauer recommends planting a portion of a field at what you believe is the optimum plant density and then increasing that value by 10%, planting additional acreage in the same field. During the season, scout the field and note observations related to plant health (lodging, tillering, ear size, etc.). Measure yield at the end of the season to evaluate whether an increase in plant population resulted in the desired outcome. Testing over multiple years to account for differences between individual growing seasons may help provide a more accurate assessment of results.
Insecticide seed treatment is included as a part of the seed expense in this example. However, you can identify that as a separate expense on line #85 if you prefer to break it down separately. If you apply in-furrow insecticide, that is an additional cost and needs to be noted on line #86. Some corn acres are a one-pass ($11.00/pass), while others are a two-pass herbicide system. Your individual circumstances will depend on the weed pressure in your fields. We have allocated $54.00 for weed control products and application expenses. Estimates for crop insurance ($25.00/acre) and soil testing ($2.50/acre) are included as well.
This example uses conventional tillage (chisel plow $22.75/acre, field cultivator $18.50/acre) and planting ($26.50/acre). The corn is combined ($44.00/acre) and hauled ($0.18/bu.) to the local elevator and then dried (6 points of moisture at $0.06/point) and stored (6 months at $0.05/bu./month). Your individual farm’s expenses in these areas could be significantly different given the machinery, grain handling equipment, and storage options you may have on your farm.
Lastly, we do have to account for the operating loan interest expense ($32.97). This is calculated by multiplying the direct operating expenses plus 20% of tillage cost by the interest rate (7.50%) for eight (8) months. We have incorporated a management expense of 5% of gross revenue ($38.89) to address the need for some contribution toward family living expenses.
Our total revenue was $777.86/acre (178 bu./acre X $4.37/bu.). Our total expenses were $1,013.33/acre, which leaves us with a deficit of $235.47/acre. The cost per bushel to break even in this example is $5.69/bu. Other Midwestern Corn Belt states have posted budgets that identify breakeven values of approximately $4.90/bu.
Upon further examination, there are a couple of things that result in higher costs in Wisconsin. First, leading corn states identify higher average yields than Wisconsin due to their growing seasons allowing them to plant and harvest longer maturity hybrids, thus increasing yield potential. Second, they have lower drying and storage costs than we do further north. Lastly, they do not identify a return to management expense which we have indicated to account for the time spent planting, managing, and harvesting the crop.
When we adjust our drying and storage costs to match the amount identified by some other states and we remove the management expense, we can produce corn for less than $5.00/bu. Each farm needs to account for their individual circumstances to calculate an accurate cost of production.
2026 Soybeans
The projected soybean budget example in the UW Crop Enterprise Budget uses the following estimates. The fifty-one (51) bu. per acre yield represents the three-year average (2023-2025) WI soybean yield posted by the National Agricultural Statistics Service (NASS). The $10.69/bu. value uses the average of the November 2026 futures contract ($11.47/bu.) and the May 2027 futures contract ($11.60/bu.) price less a basis of $0.85/bu. Contract prices and basis will vary depending on your location and are subject to change.
Using phosphorus (P) and potassium (K) soil test levels in the optimum category, the P2O5 (40 lbs.) and K2O (70 lbs.) application rates per acre were calculated based on 46-55 bu. soybean yields. Any additional nutrient credits are not accounted for in this example, so those should be considered if available and are used as discussed earlier. Lime was not applied in this example; however, it can be added if necessary.
The example includes the seed treatment (fungicide/insecticide) expense as part of the seed purchase. The planting rate was 140,000 seeds/acre at $66.00 per bag (140,000 seeds/bag). This planting rate is based on UW-Madison field research detailed below.
Figure 1. Location of 211 Trial Site-Years Included in the Database and Their Respective Environmental Cluster Classifications. Source: Shawn Conley, State Soybean and Small Grain Specialist, UW-Madison
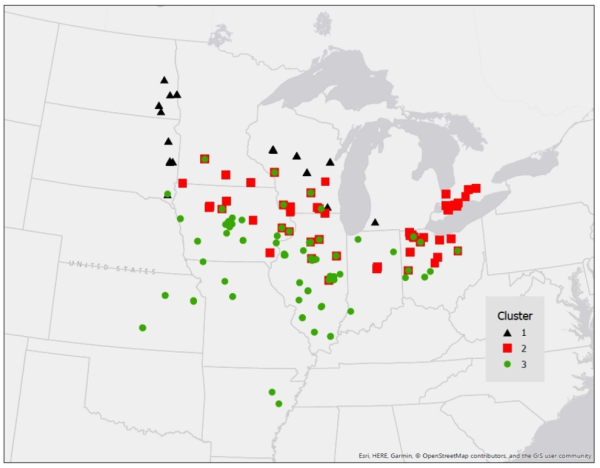
Figure 1 illustrates a total of 211 trial site years covering multiple states in the Upper Midwest were used to develop UW seeding rate recommendations. Wisconsin sites were included in this effort with northern locations represented in cluster 1, while the middle and southern portions of the state comprised cluster 2 and cluster 3 locations.
The agronomic optimal soybean seeding rate (AOSR) and the economic optimal seeding rate (EOSR) were calculated based on these group location research trials and are shared in Table 8. As illustrated, the economic optimum seeding rate ranged from 103,000 to 157,000 seeds/acre.
Table 8. Agronomic and Economic Optimal Soybean Seeding Rates by Environmental Cluster
| Cluster 1 | Cluster 2 | Cluster 3 | |
| Yield Level (bu a-1) | Agronomic/(Economic) Optional Seeing Rate 1,2 | ||
| <58 | 237/(133) | 170/(136) | 130/(103) |
| 58 – 71 | 168/(138) | 145/(157) | 136/(121) |
| >72 | 154/(119) | 128/(122) | 142/(145) |
1 Agronomic optimal seeding rate (x1,000 seeds) based on 99% maximum yield level.
2 Economic analysis based on $62.00 a unit (140k) for seed and $9.00 a bushel pricing, soybean price and seed cost fluctuations will change the EOSR.
This data confirmed Dr. Conely’s general recommendation of purchasing one bag of seed per acre. Farmers should consider reducing seeding rates on high yielding acres by approximately 20% (especially where white mold is a concern) and increasing planting rates on lower yielding acreage by approximately 20%. Seeding rates should be increased if delayed planting is experienced. A more comprehensive discussion of soybean planting date, seeding rate, pre-herbicide timing, and seed recommendations can be found at: https://badgercropnetwork.com/just-facts-jack-soybean-planting-date-seeding-rate-seed-treatment-recommendations/.
A cover crop expense of $40.00/acre (25 lbs./acre at $1.60/lb.) was added. Information on cover crops for soybeans in Wisconsin is available at: https://cropsandsoils.extension.wisc.edu/articles/cover-crop-options-for-soybeans-in-wisconsin/. Soybean acres are a two-pass system ($11.00/pass). Your individual circumstances will depend on the weed pressure in your fields. We have allocated $97.00/acre for weed management products and application expenses. Estimates for crop insurance ($20.00/acre) and soil testing ($2.50/acre) are included as well.
This example uses no-till planting ($28.50/acre). The soybeans are harvested ($41.00/acre) and hauled ($0.18/bu.) to the local elevator and then dried (2 points of moisture at $0.06/point) and stored (6 months at $0.06/bu./month). Your individual farm’s expenses in these areas could be significantly different given the machinery, grain handling equipment, and storage options you may have on your farm.
Lastly, we do have to account for the operating loan interest expense ($24.92). This is calculated by multiplying the direct operating expenses cost by the interest rate (7.50%) for eight (8) months. We have incorporated a management expense of 5% of gross revenue ($27.26) to address the need for contribution toward family living expenses.
Our total revenue was $545.19/acre (51 bu./acre X $10.69/bu.). Our total expenses were $698.37/acre, which leaves us with a deficit of $153.18/acre. The cost per bushel to break even in this example is $13.69/bu. Other Midwestern Corn Belt states have posted budgets that identify breakeven values of approximately $11.40/bushel.
Upon further examination, there are a couple of things that result in higher costs in Wisconsin. First, other Midwestern states identify significantly higher average yields than Wisconsin because of their longer growing seasons allowing them to plant and harvest longer maturity soybeans, thus increasing yield potential. Second, they have significantly lower drying and storage costs than we do further north. Lastly, they do not identify a return to management expense which we have indicated to account for the time spent planting, managing, and harvesting the crop. Each farm needs to account for their individual circumstances to calculate an accurate cost of production.
2026 Winter Wheat
The projected winter wheat budget example in the UW Crop Enterprise Budget uses the following estimates. The seventy-eight (78) bu./acre yield represents the three-year average (2023-2025) WI winter wheat yield posted by the National Agricultural Statistics Service (NASS). The $5.18/bu. value uses the average of the July 2026 futures contract ($6.03/bu.) and the December 2026 futures contract ($6.32/bu.) price less a basis of $1.00 per bushel. Contract prices and basis will vary depending on your location and are subject to change.
Winter wheat straw is the second component of income for this small grain crop. Harvested straw (1.4 tons/acre) with a value of $142.50 per ton (https://www.equitycoop.com/index.cfm?show=10&mid=300) based on recent Wisconsin market prices results in an additional $199.50 (1.4 tons X $142.50/ton) of revenue per acre. If the straw is left on the field, then you need to reduce the total amount of revenue generated for the winter wheat enterprise budget. Winter wheat straw prices can fluctuate significantly with much higher prices in winter and spring. Cleanliness and absence of weeds/weed seed can also enhance the value of the straw.
Nitrogen (N) rate is determined using the approximate cost of $0.92/lb. of N derived from the fertilizer cost calculator tab in the spreadsheet. You should enter the cost of your purchase price for fertilizer inputs and calculate the value per pound of applied nutrient. The N rate for this example was calculated using the UW-Madison Division of Extension Maximum Return to Nitrogen Rate (MRTN) wheat calculator located at https://cropsandsoils.extension.wisc.edu/articles/nutrient-management-fast-facts-magazine/.
A nitrogen:wheat price ratio of 0.125 would suggest a range of 40-65 lbs. of N per acre. Using phosphorus (P) and potassium (K) soil test levels in the optimum category, the P2O5 (70 lbs.) and K2O (50 lbs.) application rates were calculated based on 78 bu./acre wheat and 1.4-ton straw yields. Additional information on small grains fertility for Wisconsin can be found at: https://cropsandsoils.extension.wisc.edu/articles/soil-fertility-overview-for-small-grain-production-in-wisconsin-a-one-stop-shop/#Figure-1.
The wheat seed expense ($75.00/acre) in this example was calculated using a planting rate of 2.5 bu./acre at $30.00/bu. This example includes the fungicide seed treatment in the purchase price. Planting dates directly influence the seeding rate recommendations for winter wheat across the state of Wisconsin. Timely planting of winter wheat may result in a well-established and a more resilient stand that is potentially more resistant to winterkill. Avoiding late planting can also provide significant savings on overall seed cost.
Table 9. Winter Wheat Grain Yield Response to Increased Seeding Rates Across Four Locations in Wisconsin (2025). Source: Shawn Conley, State Soybean and Small Grain Specialist, UW-Madison
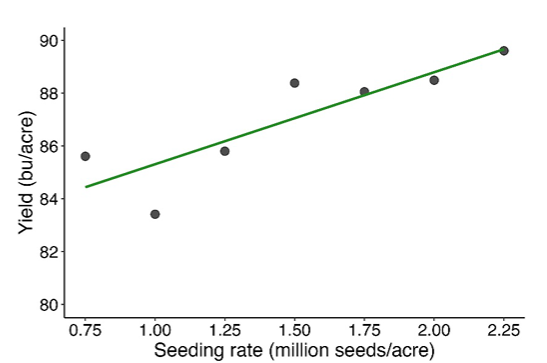
Table 9 Image Description
| Seed Rate (million seeds/acre) | Yield (bu./acre) |
| .75 | 85.75 |
| 1.00 | 83.50 |
| 1.25 | 85.75 |
| 1.50 | 88.50 |
| 1.75 | 88.00 |
| 2.00 | 88.50 |
| 2.25 | 89.00 |
Table 9 indicates how seeding rates may increase yield. Winter wheat should be planted based on total seed population, not weight alone. Winter wheat can vary from 10,000 seeds/lb. to 17,000 seeds/lb. as Table 10 illustrates. In our example we are planting 2.5 bu. (60 lbs./bu.) of wheat/acre. If our seed is 13,000 seeds/lb., we would determine our population by multiplying our 150 lbs. (2.5 bu. X 60 lbs./bu.) seeding rate by 13,000 seeds/lb. which totals 1,950,000 seeds/acre. If our seed germination is 90%, (1,950,000 seeds X .90 viable seeds), that equates to 1,755,000 viable seeds/acre.
Table 10. Wheat Seed Size an Seeding Rate Conversion Table. Source: Shawn Conley, State Soybean and Small Grain Specialist, UW-Madison
| Seeds per acre (x 1 million) | |||||
| Seeds/lb | 1.50 | 1.75 | 2.00 | 2.25 | 2.50 |
| Pounds of seed/acre | |||||
| 10000 | 150 | 175 | 200 | 225 | 250 |
| 11000 | 136 | 159 | 182 | 205 | 227 |
| 12000 | 125 | 146 | 167 | 188 | 208 |
| 13000 | 115 | 135 | 154 | 173 | 192 |
| 14000 | 107 | 125 | 143 | 161 | 179 |
| 15000 | 100 | 117 | 133 | 150 | 167 |
| 16000 | 94 | 109 | 125 | 141 | 156 |
| 17000 | 88 | 103 | 118 | 132 | 147 |
*This table is based on 100% germination. Adjust your seeding rate by the % germination printed on your seed bag tag.
Table 11. Recommended Winter Wheat Seeding Rate by Planting Date. Source: Shawn Conley, Soybean and Small Grain Specialist, UW-Madison
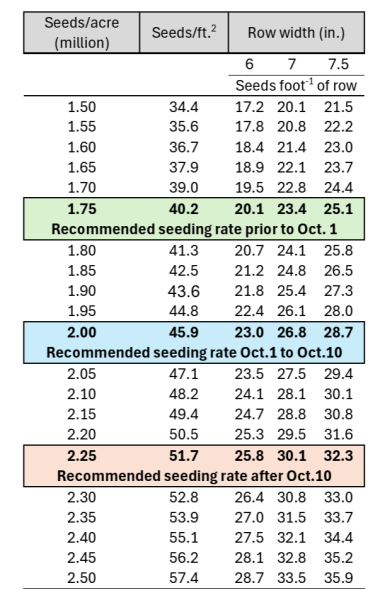
Table 11 Image Description
| Seeds/Acre (million) | Seeds/ft.2 | Row Width (in.) | ||
| 6 | 7 | 7.5 | ||
| Seeds | foot-1 | of row | ||
| 1.50 | 34.4 | 17.2 | 20.1 | 21.5 |
| 1.55 | 35.6 | 17.8 | 20.8 | 22.2 |
| 1.60 | 36.7 | 18.4 | 21.4 | 23.0 |
| 1.65 | 37.9 | 18.9 | 22.1 | 23.7 |
| 1.70 | 39.0 | 19.5 | 22.8 | 24.4 |
| 1.75 Recommended | 40.2 seeding rate | 20.1 prior to | 23.4 Oct.1 | 25.1 |
| 1.80 | 41.3 | 20.7 | 24.1 | 25.8 |
| 1.85 | 42.5 | 21.2 | 24.8 | 26.5 |
| 1.90 | 43.6 | 21.8 | 25.4 | 27.3 |
| 1.95 | 44.8 | 22.4 | 26.1 | 28.0 |
| 2.00 Recommended | 45.9 seeding rate | 23.0 Oct. 1 to | 26.8 Oct. 10 | 28.7 |
| 2.05 | 47.1 | 23.5 | 27.5 | 29.4 |
| 2.10 | 48.2 | 24.1 | 28.1 | 30.1 |
| 2.15 | 49.4 | 24.7 | 28.8 | 30.8 |
| 2.20 | 50.5 | 25.3 | 29.5 | 31.6 |
| 2.25 Recommended | 51.7 seeding rate | 25.8 after | 30.1 Oct. 1 | 32.3 |
| 2.30 | 52.8 | 26.4 | 30.8 | 33.0 |
| 2.35 | 53.9 | 27.0 | 31.5 | 33.7 |
| 2.40 | 55.1 | 27.5 | 32.1 | 34.4 |
| 2.45 | 56.2 | 28.1 | 32.8 | 35.2 |
| 2.50 | 57.4 | 28.7 | 33.5 | 35.9 |
As illustrated in Table 11, 1,755,000 viable seeds/acre would be the recommended seeding rate prior to October 1.
Seeding rates for later planting dates should be adjusted upward based on the recommended rates. Plantings made between October 1-10 should be at 2,000,000 viable seeds/acre. After October 10, seeding rates should increase to 2,250,000 viable seeds/acre.
Full University of Wisconsin-Madison winter wheat recommendations are available at: https://badgercropnetwork.com/wp-content/uploads/2025/09/Top9wheatrecs.pdf.
A cover crop expense of $40.00/acre (25 lbs./acre at $1.60/lb.) was added. Information on cover crop options for winter wheat in Wisconsin are at: https://cropsandsoils.extension.wisc.edu/articles/cover-crop-options-for-winter-wheat-in-wisconsin/.
This example uses no-till planting ($26.50/acre). The winter wheat is harvested ($39.00/acre) and hauled ($0.18/bu.) to the local elevator and then dried (2 points of moisture at $0.06/point) and stored (6 months at $0.06/bu./month). Your individual farm’s expenses in these areas could be significantly different given the machinery, grain handling equipment, and storage options you may have on your farm.
Lastly, we do have to account for the operating loan interest expense ($27.48). This is calculated by multiplying the direct operating expenses cost by the interest rate (7.50%) for eight (8) months. We have incorporated a management expense of 5% of gross revenue ($30.18) to address the need for contribution toward family living expenses.
Our total revenue per acre was $603.54 (51 bu./acre X $5.18/bu. and 1.4 tons straw/acre X $142.50/ton). Our total expenses were $829.12/acre, which leaves us with a deficit of $225.58/acre. The cost per bushel to break even in this example is $9.61/bu. However, there are additional considerations when choosing to plant and harvest winter wheat.
They include the following:
- Nutrient and fertilizer expenses can be reduced dramatically for winter wheat growers as some neighboring dairy and livestock operations may provide both the manure and application expense free for wheat acreage as these animal operations manage their supply and storage needs during the summer months.
- The midseason timing of wheat harvest often does not create the same labor stress on a farm as do the spring planting and fall harvest seasons.
- A significant percentage of tiling occurs after winter wheat harvest in Wisconsin.
- Late-summer seeding of alfalfa is an option after winter wheat harvest.
2026 Corn Silage
The projected corn silage budget example in the UW Crop Enterprise Budget uses the following estimates. Twenty-one (21.0) wet tons (65.0% moisture) per acre yield represents the three-year average (2023-2025) WI corn silage yield posted by the National Agricultural Statistics Service (NASS). The estimated $42.00/wet ton value uses the September 2026 futures contract ($4.57/bu.) price less a basis of $0.45/bu. for $4.12/bu. at harvest. Information and tools to help estimate the value of corn silage are available at: https://cropsandsoils.extension.wisc.edu/pricing-corn-silage-estimating-the-value-of-the-2025-crop/ and https://cropsandsoils.extension.wisc.edu/articles/tools-for-pricing-standing-corn-silage/. Corn silage prices vary significantly based on local conditions, growing season impacts, and conventional vs. brown mid-rib (BMR) hybrids.
Starter fertilizer used in this example was 10-34-0. Nitrogen (N) rate is determined using the approximate cost of $0.92/lb. of N derived from the fertilizer cost calculator tab in the spreadsheet. You should enter the cost of your purchase price for fertilizer inputs and calculate the value per pound of applied nutrient. The N rate was determined using the UW-Madison Division of Extension Maximum Return to Nitrogen Rate (MRTN) corn calculator available at https://cropsandsoils.extension.wisc.edu/articles/nutrient-management-fast-facts-magazine/.
A nitrogen:corn price ratio of 0.05 is recommended when growing corn silage, resulting in a range of 170-210 lbs. of N/acre, so we will use 190 lbs. N/acre. Using phosphorus (P) and potassium (K) soil test levels in the optimum category, the P2O5 (60 lbs.) and K2O (185 lbs.) application rates/acre were calculated based on 21.0 wet tons/acre corn silage yields removing 3.6 lbs. P2O5 and 8.3 lbs. K2O/wet ton of silage.
Manure and/or legume credits are not accounted for in this example, so those should be considered if available and are used as discussed earlier. Also, lime was not applied in this example, however, it can be added into the spreadsheet if necessary. Nitrogen credits will reduce fertilizer expenses. This example does not include a cover crop. Information on cover crop options for corn silage in Wisconsin are at: https://cropsandsoils.extension.wisc.edu/articles/cover-crop-options-for-corn-silage-in-wisconsin/.
Table 12. Relationship Between Corn Plant Density and Grain Yield, Economic Optimum (AGI), Forage Yield, Milk/Ton, and Milk/Acre.
The corn seed expense in this example was calculated using a planting rate of 32,000 seeds/acre at $300.00/bag (80,000 kernels/bag). Table 12 illustrates the maximum milk per acre (MPA) was achieved at 45,000 plants/acre. However, we were within 5% of the maximum MPA at 32,000 plants/acre. This illustrates how a trade off exists between forage quality and forage yield. Lower plant populations may result in a higher forage quality measurement – milk per ton (MPT), but higher plant densities can maximize dry matter (DM) forage yield.
Farmers need to consider the role corn silage fills in their individual farm ration. These roles may differ from farm to farm based on the dairy and/or livestock being fed. As was the case with corn grain, the optimum plant density for corn silage will likely vary from one farm to another and between fields within the same farm. Farmers should take the same steps outlined in the corn grain section to determine if increasing planting populations will result in the desired outcome on their individual farm operations.
Insecticide seed treatment is included as a part of the seed expense in this example. However, you can identify that as a separate expense on line #85 if you prefer to break it down separately. If you apply in-furrow insecticide, that is an additional cost and needs to be noted on line #86. Some corn acres are a one-pass ($11.00/pass), while others are a two-pass herbicide system. Your individual circumstances will depend on the weed pressure in your fields. We have allocated $54.00 for weed control products and application expenses. Estimates for crop insurance ($25.00/acre) and soil testing ($2.50/acre) are included as well.
This example uses conventional tillage (chisel plow $22.75/acre, field cultivator $18.50/acre) and planting ($26.50/acre). The corn is chopped, hauled and unloaded ($225.00/acre) and stored in a 9’ X 250’ silo bag. In this example the cost of the bagger and the silo bag are included together ($1,500.00) on line #154. Your individual farm expenses in these areas could be significantly different given the machinery, silage harvesting and handling equipment, and storage options you may have on your farm.
Lastly, we do have to account for the operating loan interest expense ($39.62). This is calculated by multiplying the direct operating expenses plus 20% of tillage cost by the interest rate (7.50%) for eight (8) months. We have incorporated a management expense of 5% of gross revenue ($44.10) to address the need for some contribution to family living expenses.
Our total revenue was $882.00/acre (21.0 wet tons/acre X $42.00/wet ton). Our total expenses were $1,413.47/acre, which leaves us with a deficit of $531.47/acre. The cost per wet ton to break even in this example is $67.31/ton. Each farm needs to account for their individual circumstances to calculate an accurate cost of production.
2026 Alfalfa – New Seeding and Established Haylage and Dry Hay
The projected new seeding and established haylage and dry hay examples in the UW Crop Enterprise Budgets derive estimates for yields based on the UW-Madison Division of Extension Wisconsin Alfalfa Yield and Persistence (WAYP) project summary data located at https://www.youtube.com/watch?v=Epu5-83ZNVo. Current hay market prices are available at: https://cropsandsoils.extension.wisc.edu/hay-market-report/. Information and tools to help estimate the value of standing alfalfa are available at: https://cropsandsoils.extension.wisc.edu/articles/pricing-standing-alfalfa/. Hay and haylage prices can vary significantly based on local conditions, growing season impacts, stand vigor and composition, and quality of the hay/haylage harvested.
Using phosphorus (P) and potassium (K) soil test levels in the optimum category, the P2O5 rates in lbs./acre and K2O lbs./acre application rates per acre were calculated based on removing 13 lbs. P2O5 and 60 lbs. K2O per ton of dry matter (DM) alfalfa.
Manure or other nutrient credits are not accounted for in this example, so those should be considered if available and are used. Also, lime was not applied in this example, however, it can be added 3into the spreadsheet if necessary.
The alfalfa seed expense in this example was calculated using a planting rate of 15 lbs./acre (75 seeds/sq. ft.) at $365.00 per 50 lb. bag. Seed treatment is included as a part of the seed expense in this example. Estimates for crop insurance ($15.00-$20.00/acre) and soil testing ($2.50/acre) are included as well.
These examples use conventional tillage (chisel plow $22.75/acre, field cultivator $18.50/acre) and planting ($26.50/acre) during establishment. If you use no-till, adjust values accordingly. Mowing and conditioning alfalfa expenses are $16.50/acre, windrowing is $13.50/acre and chopping, hauling and unloading is $65.00/acre per cutting. Harvested forage is stored in a 9’ X 250’ silo bag. In this example the cost of the bagger and the silo bag are included together ($1,500.00).
Dry hay operations include mowing and conditioning, $16.50/acre, raking, $9.50/acre, and baling at $12.00/bale. Your individual farm expenses in these areas could be significantly different given the machinery, forage harvesting and handling equipment, and storage options you may have on your farm. Each farm needs to account for their individual circumstances to calculate an accurate cost of production.
2026 Italian Ryegrass, Cereal Rye, Cool & Warm Season Cocktail Mixes, Oats & Peas
There are many choices farmers have for annual or alternative forage crops in Wisconsin that can be planted in the spring, summer, or fall of any growing season. Some potential options and their estimated yields are identified in Table. 12. Complete information on growing successful late-summer and spring planted forage crops is available at: https://cropsandsoils.extension.wisc.edu/articles/growing-successful-late-summer-and-spring-planted-forage-crops/.
Table 13. Late-Summer and Spring Planted Forage Options for Wisconsin. Source: Steve Barnhart, retired ISU Extension Forage Specialist
| Crop | Planting Time | Harventing Time | Yield Potential |
| Fall oats | Mid-August | Late-October | 1-2 tons/acre |
| Fall oats and peas | Mid-August | Late-October | 1-2 tons/acre |
| Sorghum-sudangrass | Early-August | Mid-October | 2-4 tons/acre |
| Winter cereal grain | Mid-September | Mid-May | 3-3.5 tons/acre |
| Spring oats | Mid-April | Late-June | 2.5-3 tons/acre |
| Spring oats and peas | Mid-April | Late-June | 2.5-3 tons/acre |
| Fall oats + Winter cereal grain | Mid-August | Late-October and Mid-May | 3-5 tons/acre |
| Forage brassicas | Early-August | Early October | 2-3 tons/acre |
| Italian ryegrass | Mid-April/May | Late June | 2.5-5.2 tons/acre |
| Italian ryegrass-Legume Mix | Mid-April/May | Late June | 2.5-7.5 tons/acre |
UW-Madison and UW-Madison Division of Extension research results illustrating nutrient uptake, nutrient removal, and field measured dry matter (DM) yields are included in Tables 13-16. Farmers and agricultural professionals may use this information to accurately determine the soil fertility needs for the annual and/or alternative forage crops they are selecting to plant, grow, manage, and harvest.
Fertilization requirements, nutrient uptake, and removal with harvest vary by forage species and soil-test levels. Results from three Wisconsin studies for winter rye, rye and triticale, Italian ryegrass, and Italian rye-legume mixtures are shown in Table 14-17. Studies showed optimum nitrogen (N) fertilization rates of 40 to 85 lb. N/acre (per cutting) depending on the forage (Table 14).
Table 14. Dry Matter Yield and Nutrient Removal Averages and Ranges of Selected Forage Crops from Wisconsin Studies1
| Yield Range | Harvest Nutrient | Removal | (pound per | dry matter) | ||
| Crop | Cutting | (ton per acre)3 | N | P2O5 | K2O | S |
| Winter rye (forage)4 | 1 | 1.3-3.9 | 52 (37-71) | 18 (9-29) | 80 (44-104) | – |
| Winter cereal (forage)5 | 1 | 1.4-3.4 | 56 (38-70 | 18 (16-21) | 77 (N/A) | 9 (5-14) |
| Italian rye-legume mix (per cutting)6 | 3 | 0.9-2.5 | 87 (43-143) | 28 (14-45) | 137 (62-228) | 8 (4-13) |
| Italian ryegrass (per cutting)6 | 3 | 0.9-1.7 | 64 (13-28) | 22 (13-28) | 106 (64-142) | 7 (4-9) |
1 Yield, uptake and removal represent instances when optimum fertilization was applied
2 Dry matter
3 Values are means across study with ranges in parentheses
4 Stute, Shelley, Mueller, and Wood (2007)
5 Jarek, Fulwider, Marzu,, Reuss, Schuler, Shelley, and Jones (2023)
6 Jones, Jarek, and Arriaga (2023); yield, N rates, and nutrient uptake values are per cutting
Table 15 shows nutrient removal rates did not vary widely between studies. On average, 17 to 18 lb. P2O5/acre, 81 to 84 lb. K2O/acre, and 4 to 5 lb. Sulfur (S)/acre were removed per ton of dry matter across all forages (Tables 15 and 16). Soil texture, fertility levels, pH, and weather conditions during the growing season all impact uptake and removal levels.
Table 15. Dry Matter Yield and Nutrient Uptake of Selected Forage Crops from Wisconsin Studies1
| Yield Range | Nutrient Uptake | (pound per acre) | ||||
| Crop | Cuttungs | (ton per acre)2 | N | P2O5 | K2O | S |
| Winter rye (forage)4 | 1 | 1.3-3.9 | 121 (69-178)3 | 42 (29-71) | 178 (110-344) | – |
| Winter cereal (forage)5 | 1 | 1.4-3.4 | 129 (61-210) | 42 (26-61) | 177 (101-269) | 9 (5-14) |
| Italian rye-legume mix (per cutting)6 | 3 | 0.9-2.5 | 87 (43-143) | 28 (14-45) | 137 (62-228) | 8 (4-13) |
| Italian ryegrass (per cutting)6 | 3 | 0.9-1.7 | 64 (34-90) | 22 (13-28) | 106 (64-142) | 7 (4-9) |
1Yield, uptake and removal represent instances when optimum fertilization was applied
2Dry matter
3Values are means across study with ranges in parentheses
4Stute, Shelley, Mueller, and Wood (2007)
5Jarek, Fulwider, Marzu,, Reuss, Schuler, Shelley, and Jones (2023)
6Jones, Jarek, and Arriaga (2023); yield, N rates, and nutrient uptake values are per cutting
Table 16. Dry Matter Yield and Nutrient Uptake Averages and Ranges of Selected Forage Crops from Wisconsin Studies1
| Yield Range | Nutrient Uptake | (pound per acre) | ||||
| Crop | Cuttings | (ton per acre)2 | N | P2O5 | K2O | S |
| Winter rye (forage)4 | 1 | 1.3-3.9 | 121 (69-178)3 | 42 (29-71) | 178 (110-344) | – |
| Winter cereal (forage)5 | 1 | 1.4-3.4 | 129 (61-210) | 42 (26-61) | 177 (101-269) | 9 (5-14) |
| Italian rye-legume mix (per cutting)6 | 3 | 0.9-2.5 | 87 (43-143) | 28 (14-45) | 137 (62-228) | 8 (4-13) |
| Italian ryegrass (per cutting)6 | 3 | 0.9-1.7 | 64 (34-90) | 22 (13-28) | 106 (64-142) | 7 (4-9) |
1Yield, uptake and removal represent instances when optimum fertilization was applied
2Dry matter
3Values are means across study with ranges in parentheses
4Stute, Shelley, Mueller, and Wood (2007)
5Jarek, Fulwider, Marzu,, Reuss, Schuler, Shelley, and Jones (2023)
6Jones, Jarek, and Arriaga (2023); yield, N rates, and nutrient uptake values are per cutting.
Values shown in Table 17 are for soils with 2.0 to 9.9% soil organic matter and optimum soil-test P and K. Fertilization requirements are based on soil-test level and estimated removal. Fertilization planning for the following year’s crops should consider nutrient removal of alternative forage crops in addition to guidelines provided by A2809 Nutrient Application Guidelines for Field, Vegetable, and Fruit Crops in Wisconsin. Soil sampling after alternative forage crop harvest and planting of the next crop in the rotation is advised.
Table 17. Dry Matter Yield, Fertilization Requirement, and Nutrient Removal of Selected Forage Crops1
| Crop | Yield Range (ton per acre)2 | Nutrient Requirement (pound per acre)3,4 | Harvest Nutrient Removal (pound per ton dry matter) | |||
| N | P2O5 | K2O | P2O5 | K2O | ||
| Small grain silage5 | 2.0-3.5 | 40 | 30 | 120 | 11 | 44 |
| Small grain and legume silage6 | 2.0-3.5 | 15 | 30 | 120 | 11 | 44 |
| Surghum-sudangrass | 5.0-7.0 | 100 | 90 | 360 | 15 | 60 |
| Rye, winter silage | 2.0-3.0 | 60 | 50 | 220 | 18 | 80 |
1UW A2809 Nutrient Application Guidelines for Field, Vegetable, and Fruit Crops in Wisconsin.
2Dry matter
3Nitrogen rates for soils with soil organic matter content between 2.0-9.9%. See UW A2809 for recommended rates at other levels.
4P2O5 and K2O rates for optimum testing soils. See UW A2809 for recommended rates at other soil-test levels.
5Barley, oats, rye, triticale, or wheat
6Small grain with inter-seeded field pea or bean
Your individual farm expenses in these areas could differ significantly given the specific crop species, time of planting, machinery used, forage harvesting and handling equipment, as well as storage options you may have on your farm. Each farm needs to account for their individual circumstances to calculate an accurate cost of production.